Live Monitoring Web App
Lightweight, real-time web application providing live temperature data, GNSS information, statistics, and logging access. Designed for pit use to monitor the vehicle on track over Wi-Fi.
What it provides
- Live brake and tyre temperatures (FL/FR/RL/RR)
- GNSS stats (satellites, speed, position, PDOP)
- Live graphs with selectable time window and per-corner toggles
- On-device logging access (view/download CSV logs)
- At-a-glance “Vehicle Gauges” mirroring the in-car display states
UI Structure
The UI is block-based: each panel is readable at a glance and maps directly to a data source.
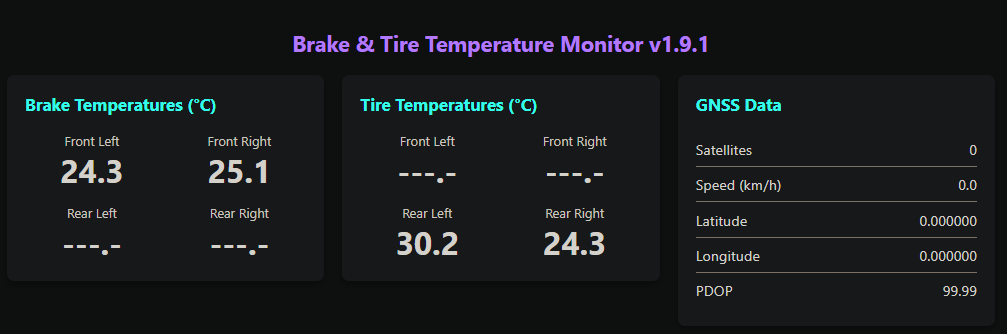
Live values and GNSS statistics
Instant state: brakes, tyres, and GNSS.
Live values: brake/tyre temperatures per corner + GNSS summary.
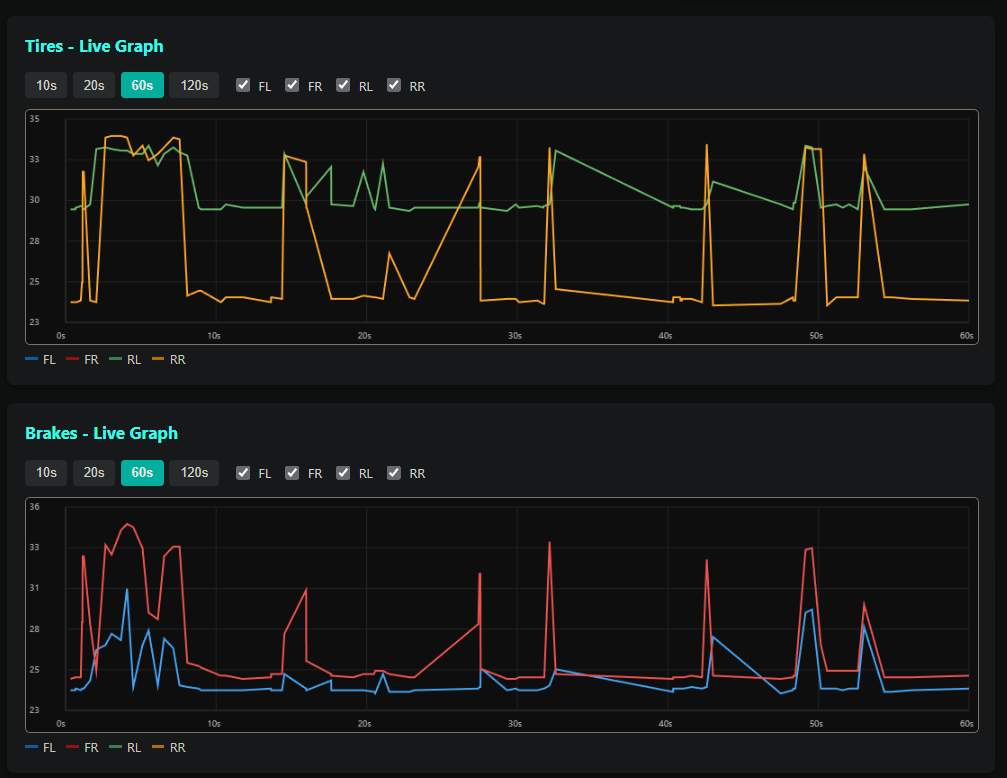
Live Graphs
Time-window buttons and per-corner toggles let you isolate one wheel, one axle, or compare corners.
- Quick window select (e.g. 10s / 20s / 60s / 120s)
- Corner toggles (FL/FR/RL/RR) for isolation and comparison
- Optimised for live readings in the Pits
Two graphs: tyres + brakes. Select time range and show/hide corners.
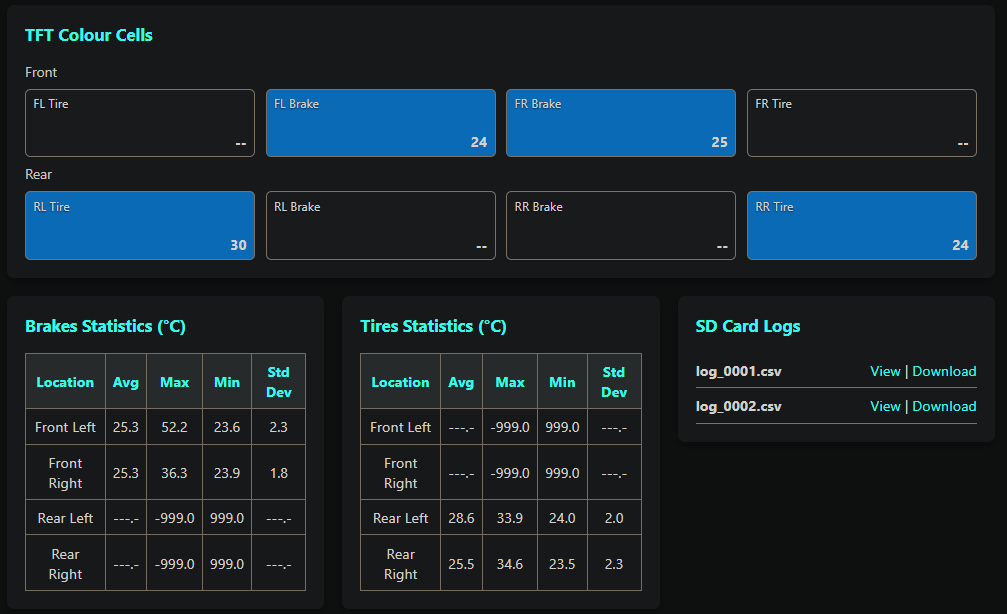
Vehicle gauges mirror, more stats for nerds, and logs panel
BTTM Remote Gauges
Mirrors the in-car display gauge mapping. Useful when you want the pit laptop to match what the driver sees.
Logs
View live raw data or download past sessions CSVs from the BTTM on the vehicle.
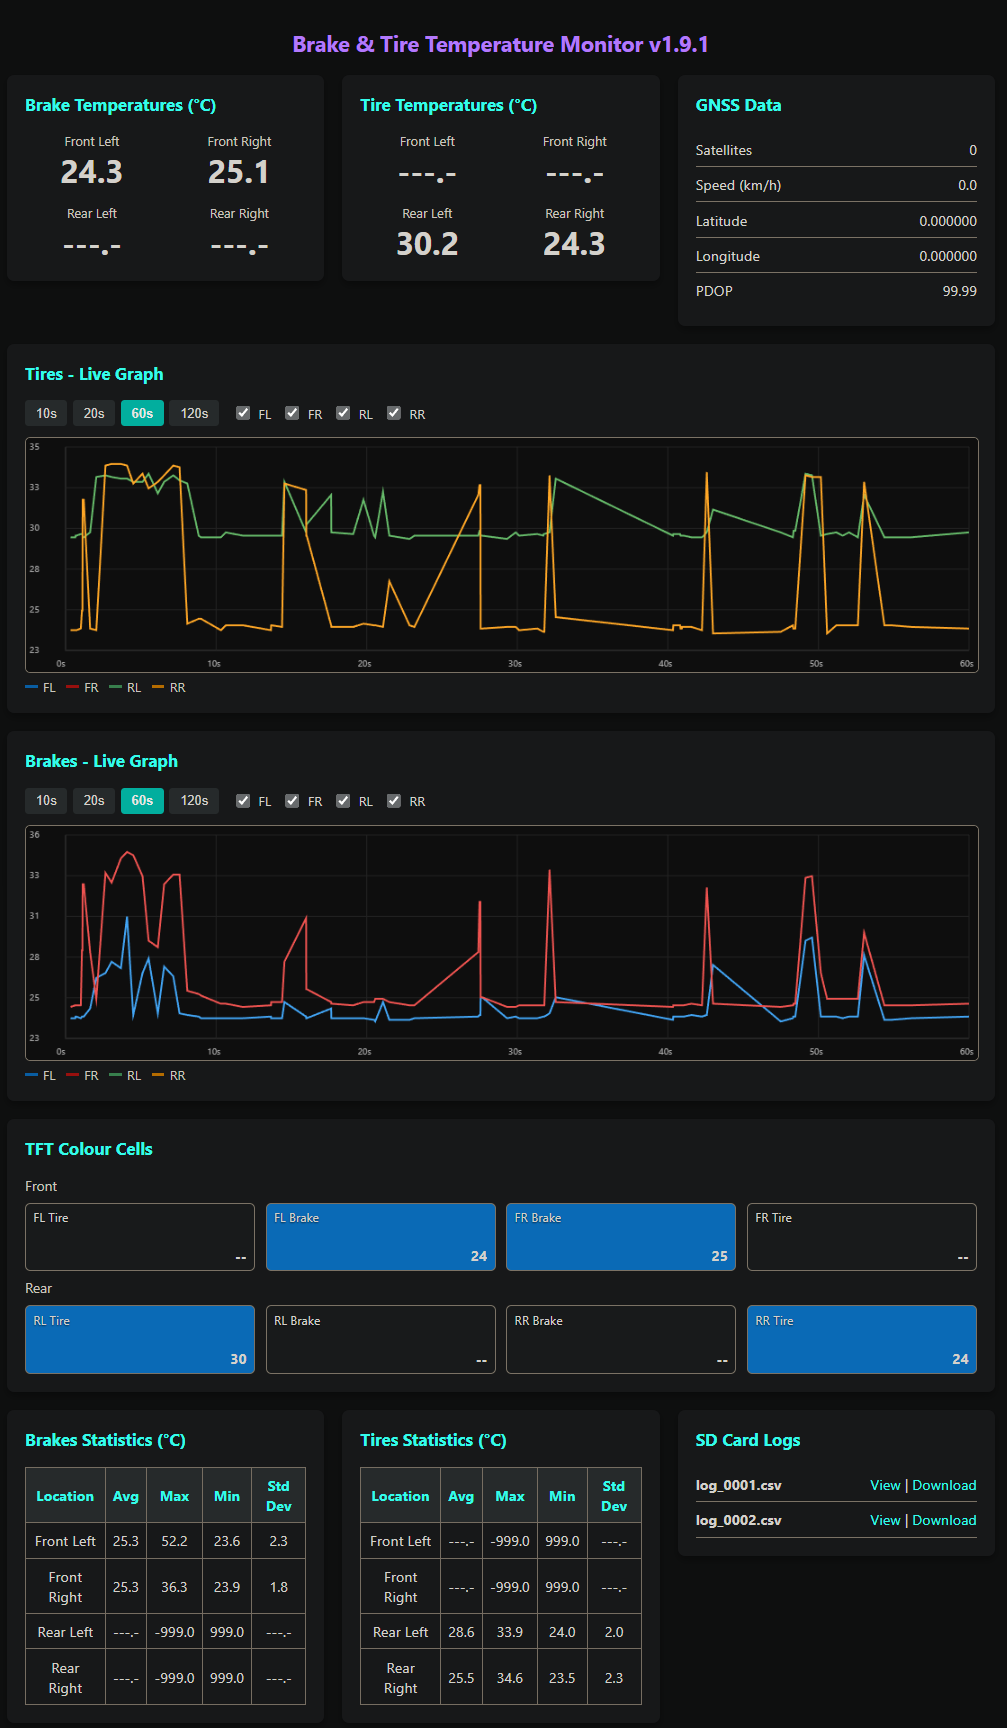
Status cells + statistics + SD logs (view/download).
Show full UI screenshot